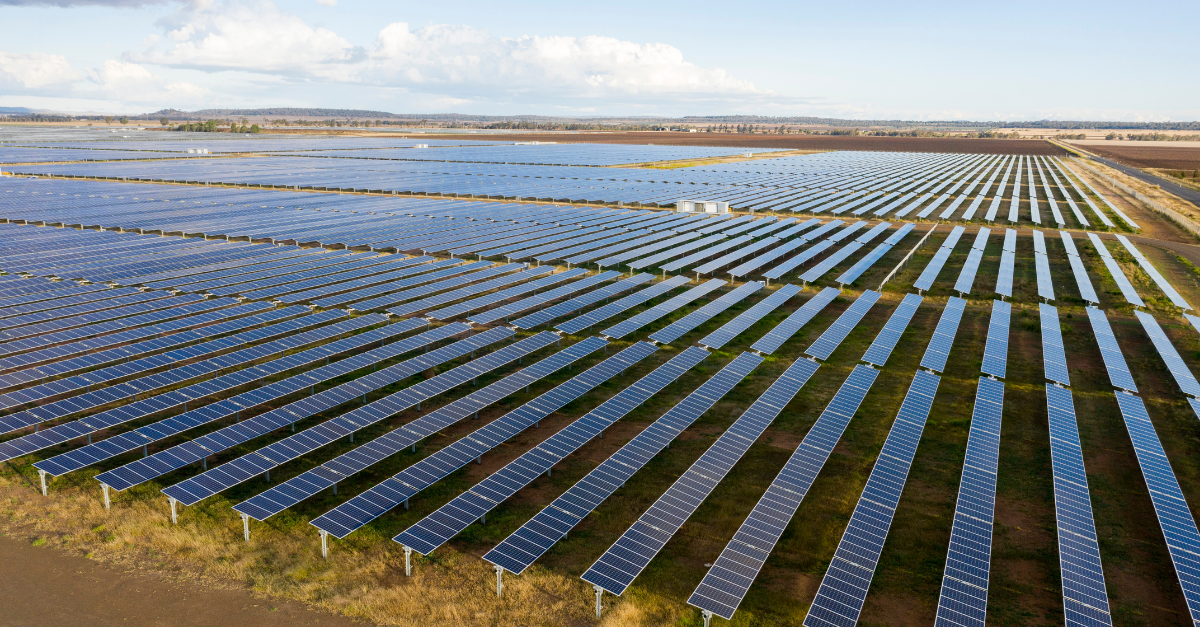
As solar PV plants grow and become more heterogeneous, analysing the performance at panel level becomes more complex.
Compared to other technologies such as wind, solar assets need more components to produce the same amount of energy, and this results in an increase in the volume of measurements and data. There are around 4.000 panels per MW of capacity, so, how can we analyse the performance of the PV asset at panel/string level? How do we know which panels/strings are affected? What do we use as a reference figure? How much should the panels be producing based on the irradiance?
These questions may be relatively easy to answer for small, homogeneous portfolios. By opening the SCADA for each site, you can quickly see values of the string.
However, as renewable energy portfolios become increasingly heterogeneous, addressing production losses becomes more complicated. Different panel manufacturers, multiple configurations, different tracker technologies and communication systems, all need to be considered when assessing where production losses are coming from.
The sheer volume of information means that Asset Managers have an extremely challenging job when addressing the main energy production loss drivers at panel/string level.
Data collection, standardisation and storage are all key to ensuring a clear overview of where and why a portfolio is losing energy production due to panel/string issues.
To support the work of Asset Managers, Quintas Energy has created an effective solution to help establish which panels/strings are suffering production losses so that the repair activities can focus on the specific area to optimize the asset’s production.
Our String Analysis Tool, built on top of data governed by our Digital Twins, provides a quick way to view production losses affecting renewable energy portfolios at panel/string level. Digital Twins allow us to define the manufacturer and the configuration of all panels in order to create a reference. Additionally, it allows us to identify the production impact in a single line diagram of the plant. This system gives a bird's eye view of how the panels/strings are performing and then helps the user to determine more quickly why they are performing as such.
Digital Twin information at panel/string level:
- Panel Manufacturer/Model
- IV Curve (Imp, Vmp, Isc, Voc)
- String Configuration (U or Line / Portrait or Landscape)
- Combiner Box and Inverter Configuration
- Panel Replacement
- Serial Number
Understanding where solar portfolios are losing energy production is the first step towards establishing what technical issues must be addressed first and how expenses and investments should be prioritised.
Without the right governance structures, the management of portfolio data is a never-ending challenge.
Through our unique Digital Twins methodology, renewable assets are integrated into one easy-to-use online platform. This makes the collection, standardisation, and storage of data so much simpler. The String Analysis Tool allows you to see which specific panel/string is causing energy production losses (for example, which string of which asset is underperforming due to shadows).
Additionally, other Quintas Energy services linked to Digital Twin data at panel level can provide a complete analysis of the status of panels throughout the lifespan of assets, such as drone services, IV curve tests, panel replacement, incident registering, and preventive maintenance.
If you want to test our String Analysis Tools to analyse the performance of your panels, contact us straight away!


